An Introduction to Data Normalization.
Congratulations! Your organization is growing. Currently all of your Contact and Sales information has been living in one or more spreadsheets. This has worked up until now, but record keeping and reporting is becoming more and more of a time sink as you wade through hundreds or thousands of records. You’ve done some research into data management and CRM solutions and made the (wise) decision to migrate your data into Salesforce.
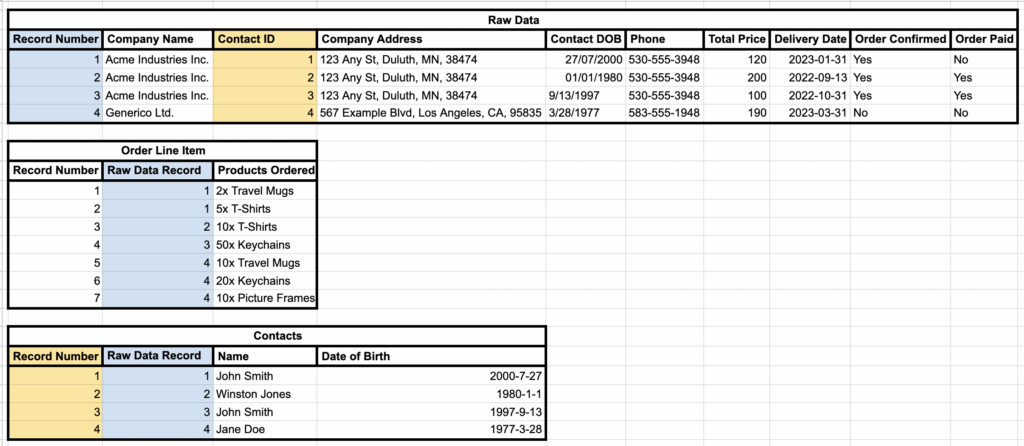
There’s one small problem. Your sales and pipeline data currently looks like this:
This worked at the beginning, but if you upload everything into Salesforce the way it is now, you’re recreating the same system and all its constituent difficulties, just in a different, costlier platform.
There’s an axiom that is well-known among programmers, data scientists and anyone who works with reporting and data on a regular basis:
“Garbage in, Garbage out.”
Your results are only as good as the cleanliness and organization of the data you feed into the system. So, let’s start cleaning up this data and get it ready for import. Our first task is something called Data Normalization.
Data Normalization 101
Data Normalization refers to the process of preparing a dataset for insertion into a relational database. To oversimplify, the goal is to minimize the amount of data that’s duplicated or stored in more than one place. To use our dataset at the beginning as an example, you’ll see that the Company Address and phone number for Acme Industries is stored multiple times. Acme shows up multiple times because there are multiple sales, some with the same product. This makes data entry more time consuming as the same information must be copied to multiple rows. You risk data inconsistency if information changes – a company moves, or a contact moves to a different company. As the scope and volume of the data you track increases, normalization becomes increasingly important to ensure your information is accurate and consistent.
We touched briefly on one of the primary benefits of normalizing your data in the previous paragraph – data sanitation, or ensuring that there’s only one record that’s a “Source of Truth”. There are a few more reasons where normalizing your data will make your life easier in the long run:
- Linking information (especially requiring things like customers or contacts to have their own records) makes it easier to summarize and report on your data
- When information changes, It will only need to be updated in one place, instead of potentially several hundred
- A well-defined data model and interface makes looking up details on related records much easier
- Reporting on your data and being able to bucket, summarize and visualize your information gets streamlined.
Now, you may be asking yourself “What does this have to do with Salesforce?” and you’d be correct to do so. This *is* a Salesforce blog after all. The short answer is that when you strip away the user interface, the customization, the App Exchange and all the other bells and whistles, Salesforce is a relational database. Data normalization and having a cohesive data model is just as critical in Salesforce as it is in SQL Server, MySQL, Access, DB2 or any other database engine you care to name.
Next, we will go through the first three stages of normalization using the sample data provided in the introduction.
The Data
The dataset that we’re working with is the sales and order records for a hypothetical company that sells branded items. Think of the little tchotchkes you would get while attending a business conference or convention. Mugs, thumb drives, keychains, t-shirts, caps, etc. A real-world equivalent would be something like CafePress or Vistaprint.
As a reminder, here’s the starting point:
So, we have a mix of Company information, Contact info, a product list, pricing, delivery information and a payment flag. That is a lot of disparate information crammed into a single table. Not only does this make updating information a challenge (this is a sample – assume the actual ‘production’ dataset is 50-100+ times larger than this) but getting accurate reporting information would be extremely difficult and time-consuming.
So let’s start cleaning this up. We’ll be going through three normalization steps, with one piece of pre-work that we need to do first.
Stage 0 – Key your Records
The first step, before you make any changes to your data structure is to define a “Primary Key” – The Primary Key is the unique identifier for any given record. This is used to disambiguate between multiple similar records and make things like Lookups easier.
You can format this however you want, but for the purposes of this demonstration, we’ll just assign each record a unique number, counting up from 1. We’ll do the same for any future tables we build or break out from the main.
Stage 1 – Break out Nested Lists
A Nested List is any data point that holds multiple pieces of similar information. In the example we’re working with, this can be seen in the “Products Ordered” column. You’ll see that two records have multiple items listed in the same cell. To achieve 1st Stage Normalization, we need to break these lists out into their own table, and link that information with the original data set. It’s a good thing that there’s a way to unambiguously refer to the original row. We’ll call this table “Order Line Item”. We will also be breaking each list into individual records, so, for example, the order in Line 4 that has three separate line items, will have three separate records in our new table.
We’ve added highlighting to the columns that illustrate the link between the two tables. Looking through the tables now, there aren’t any more nested lists to be found in the dataset, so we’ll now be moving on to Stage 2
Stage 2 – Eliminate Compound Keys and Unrelated Fields
A Compound Key is where you need to reference two different columns to ensure that a record is unique. An example in our sample data set can be found in the Contact Name and Contact DOB columns. Acme Industries has two records where the Contact Name is “John Smith” – initially you’d think that they’re the same person, until you look at their birthdates and realize that they’re in fact two different people with the same name, born three years apart. This makes the combination of the Name and Birthdate a Compound Key.
Additionally, the fact that you have multiple people listed as a contact for the same company on each record implies that the Contact’s information isn’t related to the company for whom they work. There’s nothing stopping either John Smith from leaving Acme and going to work for Generico, for example. The Contact and any fields directly related to the individual person (Date of birth) really should be spun out into its own table. So we’ll do that now.
An argument could be made that we’re not done yet – Company Name, Company Address and Phone could also be spun off into their own table in this step, but for the purposes of this post, we’ll be handling that in the next stage.
Stage 3 – Transitive Functionality – Break out New Tables from Existing Data
The last step that we’ll be covering is where the data model will really start to take shape. The goal is to break out and compartmentalize the data so that every column in a given table is directly related to the table’s subject.
We’ve already started doing things like this with the Order Line Item and Contacts tables that we’ve built out in Stages 1 and 2, but there’s more work to be done. First we need to define what exactly that “Raw Data” table is tracking. It’s not Companies or Customers since you have the same company name coming up multiple times. Looking over what we have left, we can make the determination that Raw Data is really a Sales or Order sheet. So let’s rename that table to Orders.
Now, go through every column in the table and ask the following questions:
- Is this a piece of information that’s directly related to, and unique to this record?
- If not, what type of information is this data point related to?
Going through this line of questioning for everything we’ve done so far, we can make the following improvements to our data model to achieve third Stage Normalization:
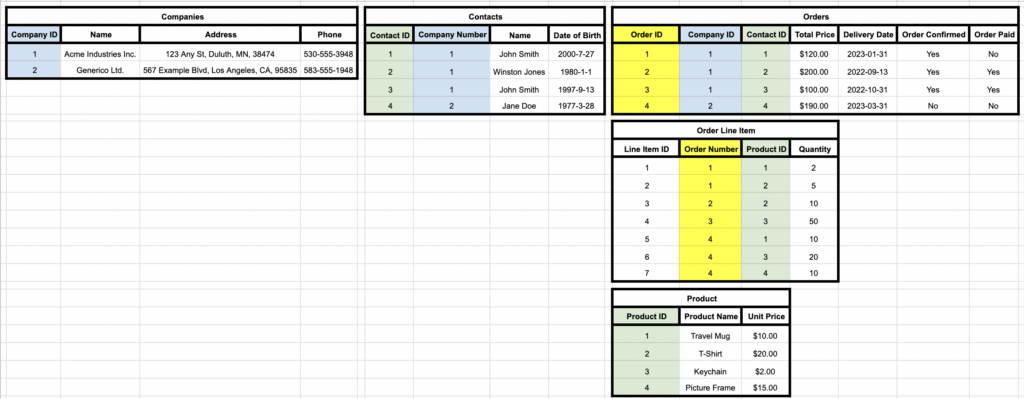
- Company Name, Company Address and Phone can be broken out into a “Companies” list
- A column can be added to “Contacts” that links the individual to their employer
- Order Line Item can be further refined by breaking the Quantity and Item into separate fields
- A Product table can be created to show unit pricing and automatically calculate subtotals on the Order list.
Here’s what the data looks like now with all the changes we’ve just mentioned.
The highlighting is intended to show the relationships between each table. Compartmentalizing data in this way allows for more robust reporting, easier data management, and more potential for effective automations to be built. A well-normalized data model will also make data hygiene much easier, as duplicates and other redundant data will be more apparent with a single ‘source of truth’ for each data point. At this point, the data is ready to be uploaded into Salesforce – once you’ve created any required custom objects and fields.
It may appear complex and time-consuming at first, but it is well worth the effort. Data normalization is the first step in building a robust, scalable data model that will support the growth and evolution of your org.


