Improve Salesforce Reports with Formulas
Salesforce Reports and Dashboard are cornerstones for Marketing Operations and Sales Operations teams of all shapes and sizes. They provide the ability to compile and analyze large amounts of Salesforce data quickly and easily. They are critical to helping companies understand past performance and provide leading indicators for future results.
While organizations may rely on Salesforce Reports, there is one reporting feature that takes organizations’ reporting capabilities to the next level.
Summary and Row Formulas
Similar to how creating custom fields in Salesforce can increase the value to a particular record, Salesforce Reports allow you to create customized calculations based on your Salesforce data to drive more meaningful insights.
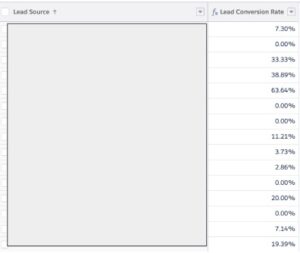
A good place to start is layering conversion rates into your Marketing Lead Source reports. For example, a Marketing report that tracks how many Marketing leads are being generated each month by Lead Source.

Assuming the report has Lead Source grouped in a Summary report, a formula such as the one above (CONVERTED:SUM/RowCount) can be inserted to give you a column that calculates the conversion rate for each of your Lead Sources. This allows you to quickly identify which sources are driving the best leads and which might be generating lead volume, but not lead conversions.
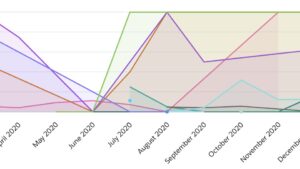
To take it one step further, adding a time grouping to your data, such as Lead Create Date, then shows how your conversion rates are trending over time.
These same types of calculations can be applied to other areas, such as identifying Opportunity win rates by Sales Rep, Industry, or other segments that matter.
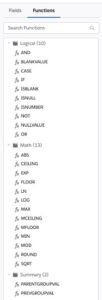
Beyond simple calculations, more advanced Salesforce Function calculation options also exist for deeper analysis with Logical, Math, and Summary capabilities.
An example of this is the following calculation that calculates the percentage of revenue based on Product Schedules.
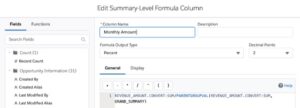
Laying this into a Summary report grouped by Account or Industry provides a great analysis of where revenues are currently being derived.
Interested in Learning More?
New to Formulas?
- Check out this Trailhead Project on how to Evaluate Report Data with Formulas.
Already using Formulas?
- Drop me a note. I love hearing how others are using formulas and the insights they’re providing.
Looking to step up your Salesforce reporting game?
- Check out this Trailmix I created dedicated to Salesforce Reports and Dashboards.