
Einstein Discovery (ED) is an AI-driven analytics platform that allows Users to get deeper insights and predictions out of their data, based on historical data without having to build complicated machine learning/AI models by themselves. Einstein Discovery is known for creating sophisticated models, but the data provided must be good quality (remember: garbage in, garbage out). It is the responsibility of the User to provide clean data, which can be challenging. It involves understanding the data, which columns can be removed, which columns need to be transformed, and how to create the best possible data sets.
ED is outcome-focussed. If you’re looking for users who are going to churn then you want to make sure you have historical data of the users who did churn. If this data lives in Salesforce, that’s great – just make sure CRM Analytics is properly connected to your Salesforce org. If this data lives elsewhere, CRM Analytics (formerly Tableau CRM) offers many out-of-the-box connectors, as well as the ability to simply upload a CSV extract of your data.
To prepare data for ED we will be using a Data Prep Recipe. This is a powerful tool available in CRM Analytics that allows users to transform their data with ease. It’s a great tool to combine datasets or connected objects and make transformations.
Each Recipe will start with an input node that will bring in the data. Data can come from a connected data source like SFDC or from an existing dataset. Users can then branch off the input node by selecting different types of nodes based on the operations you wish to perform. These operations include: Transform, Filter, Aggregate, Join, Append, Output.
Review of Operations
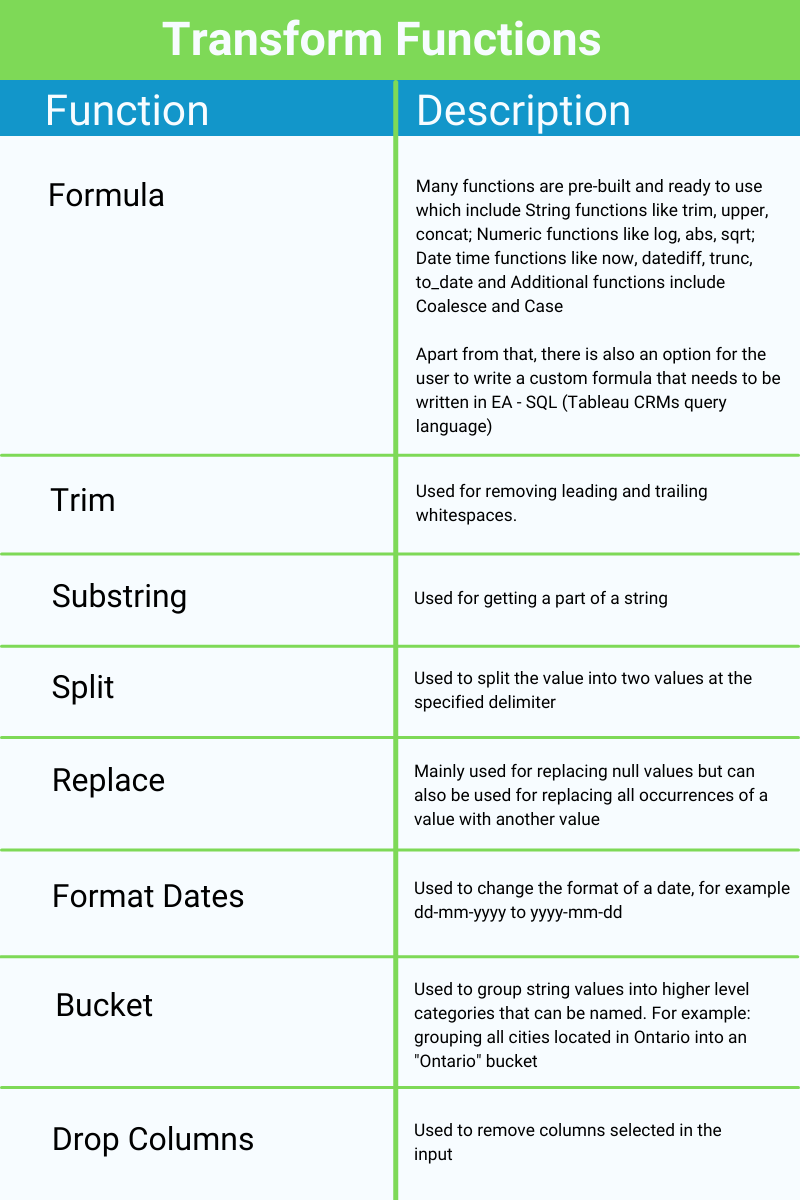
Transform
Filter
Filters help to remove any unwanted data and leaves you with only the data required for the analysis. For example: if you only want to analyze data created from 2020 onwards, you can apply a filter to eliminate records that do not satisfy this requirement.
Aggregate
This operation is useful to summarize a data set that is very large. It is similar to the pivot table feature of excel, but with more functionality. One thing to note is that it does not allow Users to add groups without aggregates.
Aggregates: An aggregate will define what operation will be used to aggregate your data. These are many formula options such as Sum, Average and Count. For a full breakdown, you can refer to this Salesforce documentation on Aggregate Nodes.
Once aggregates have been added, you’re able to choose which columns data will be grouped by. For example, you could count how many Account records are in each city using the following:
Hierarchical Aggregation:
A new feature to handle multi-level data. It is used to apply aggregation to any hierarchical data to sum values at each level of the relationship, instead of calculating manually. Example, It can be used to roll salesperson data up the management chain to see aggregates by team or director.
Join
Joins are similar to the joins concept of the database with few additional options. When selecting join, the first step is to select the dataset to join with and then mention the keys to join the data. There are 5 types of join options available.
Lookup: Includes all rows from the recipe dataset and only matching rows from the filter dataset. When multiple record values are found returns only one record.
Left: Includes all rows from the recipe dataset and only matching rows from the filter dataset. When multiple record values are found, returns all records.
Right: Includes all rows from filter dataset and only matching rows from recipe dataset. When multiple record values are found, returns all records.
Inner: Includes only matching records from the filter and recipe dataset. When multiple record values are found, returns all records.
Outer: Includes all rows from both datasets regardless of matching rows. When multiple record values are found, returns all records.
When choosing a join type, it is important to consider what you want your end result to be. For example, when selecting a Right join, the volume of data in your final dataset will likely be much higher than if you select a Lookup or Inner join.
Append
Append is used to combine similar datasets by mapping the fields from the recipe to the selected data source. Appended rows will show null values for recipe columns that aren’t mapped.
Output
Output is used to store the transformed data either as a CSV file or as a dataset.
Putting it in to Practice
Let’s get our hands dirty and clean and create a dataset by using some of the features discussed above. We’ll be working with Opportunities, Accounts and User datasets.
While it’s possible to combine all of the steps in a single Recipe, for the purposes of this exercise, we are going to use two separate Recipes. Creating base datasets (as we’ll review in Part 1) is helpful when working with a complex Salesforce org that requires you to join many objects in order to perform analytical tasks.
In Part 1 we will not include any transformations/filter nodes in the Recipe. We want to create a base augmented dataset, as we will likely have many use cases for Opportunity data that has been enriched with Account and User data in the future. By creating the base dataset, we will not have to recreate these joins or perform the initial data cleaning work each time we want to perform an analysis on this Opportunity data. In Part 2, we will review examples of common transformations.
Part 1: Creating the Base Dataset
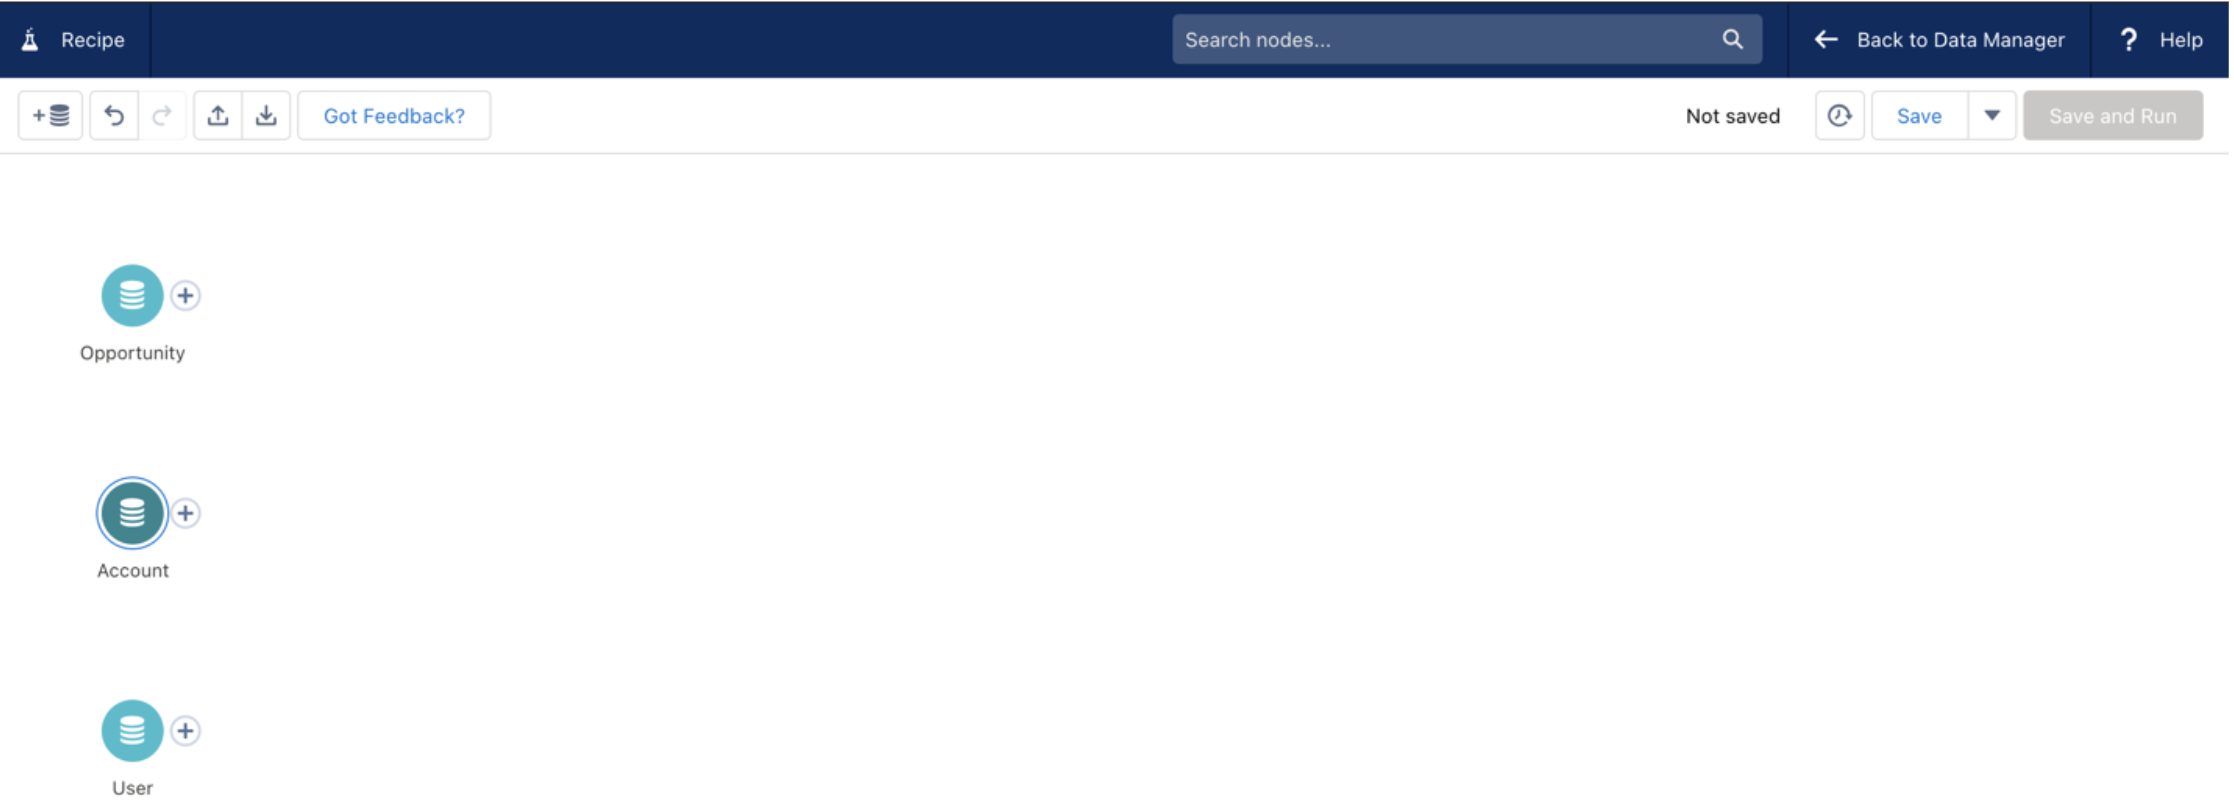
To start, use input nodes to import Opportunity, Account and User data in the Recipe
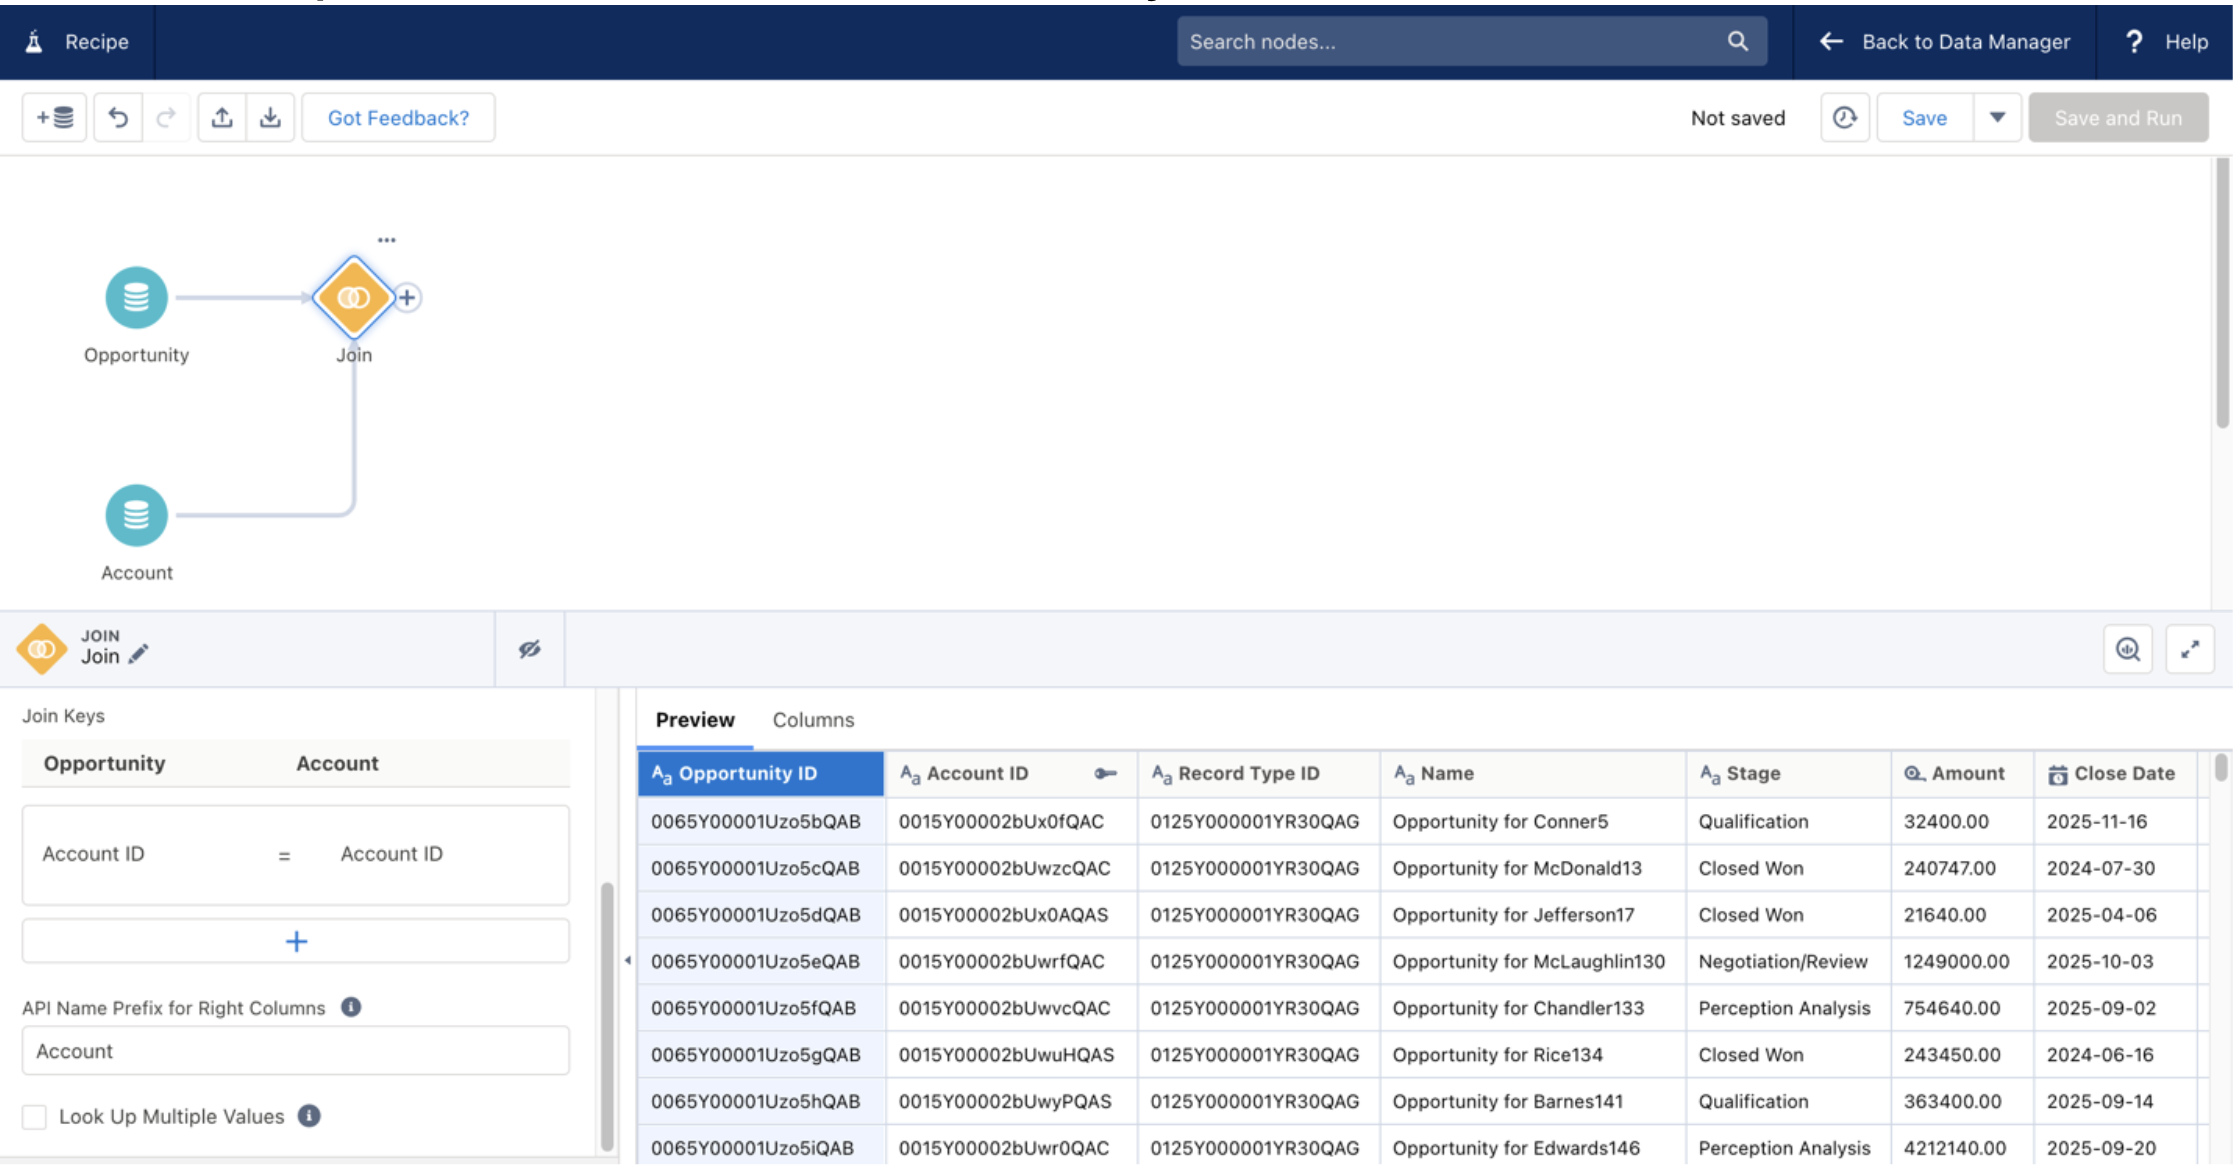
Next, join the Opportunities and Account data based on the AccountId fields as our join key. This will allow us to pull relevant data from the Account object to our Opportunities. Keep data granularity in mind here – because our Opportunity data is the most granular, we will likely want to start with (and keep) this data on the left side of our joins.
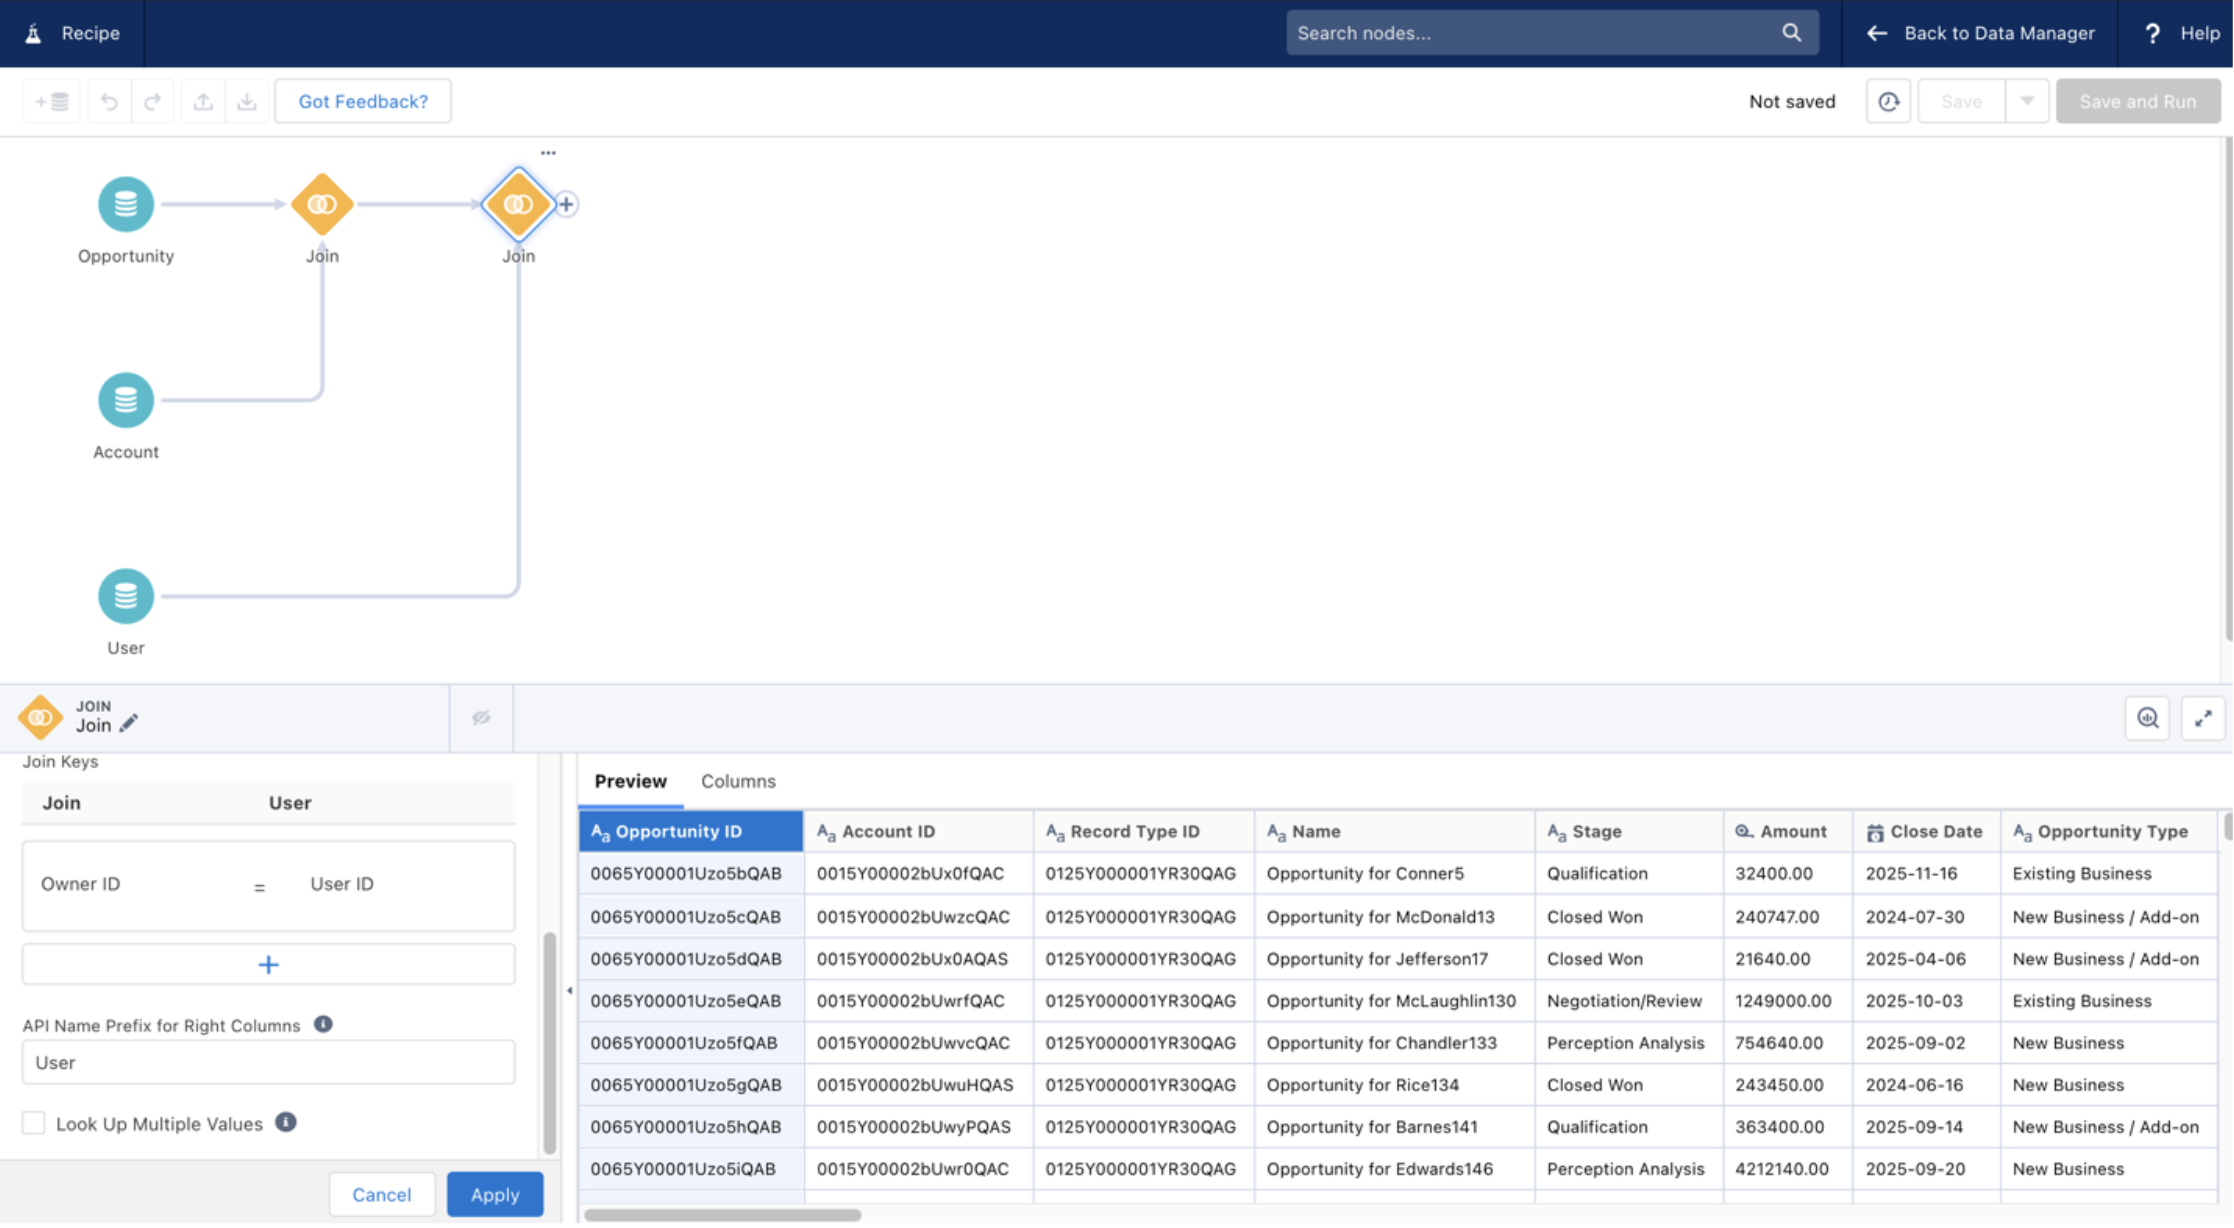
After that, create another join node that will join User data to our newly augmented Opportunity data. This should use the OwnerId (from the opportunity) and UserID field (from the User object) as our join keys to join the nodes. This will enable us to pull in any details of the owner (such as their name) that we’d like to use in the exercise.
Create an output node and name it appropriately.
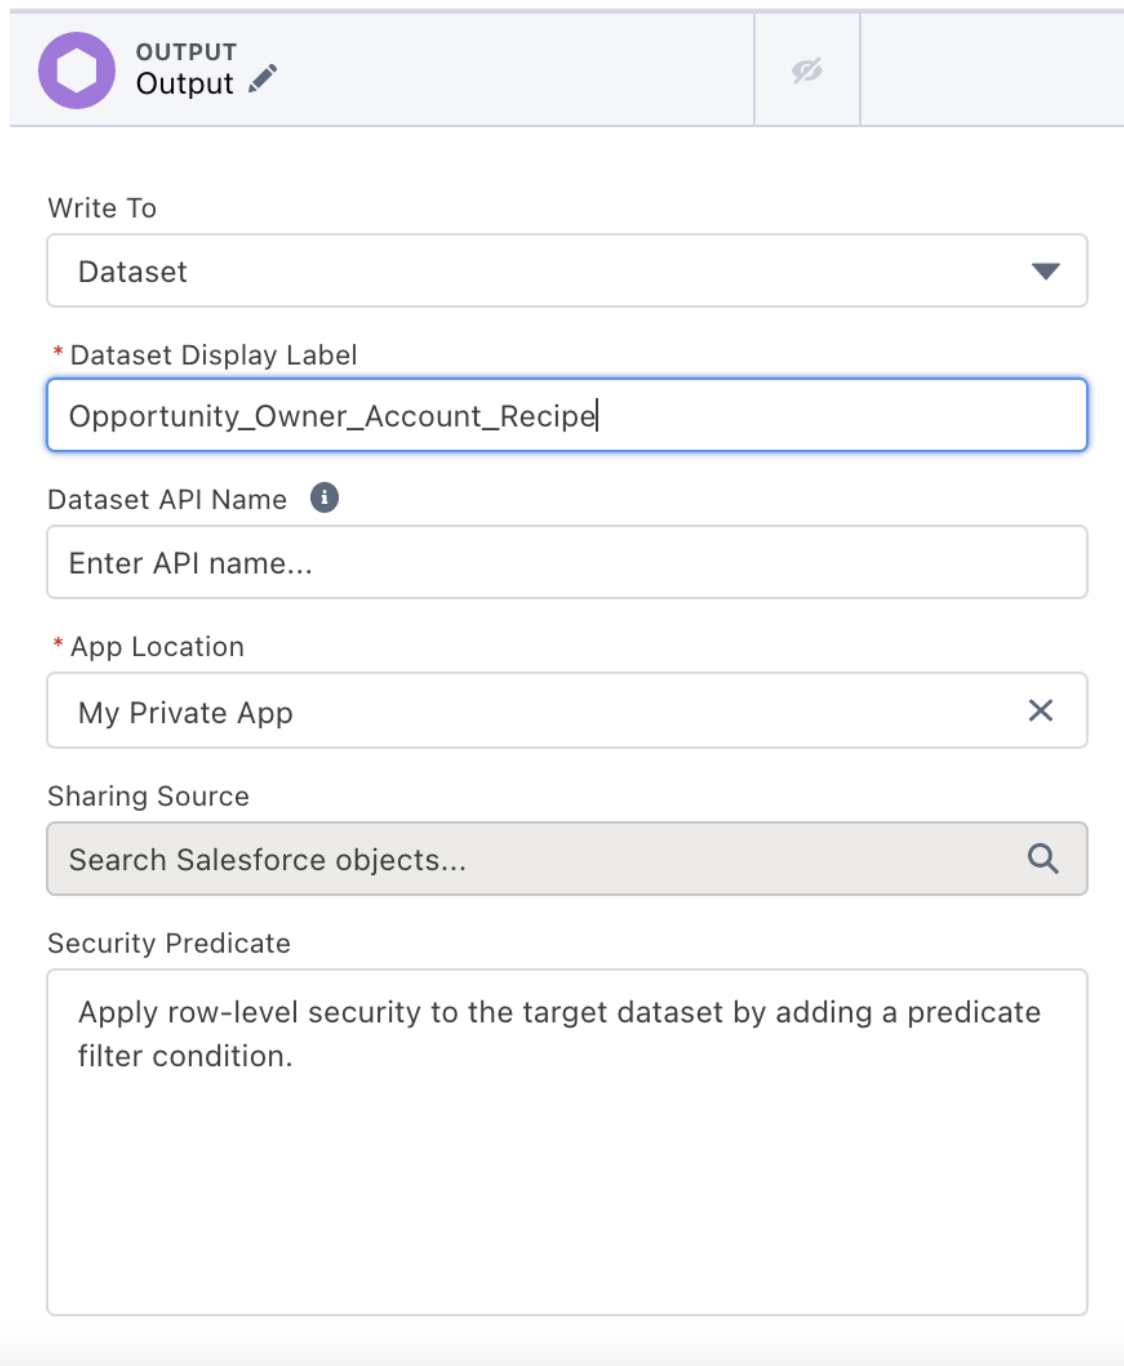
Finally, choose the columns needed in the final dataset, then Save & Run the Recipe. You can give it a name like “Opportunities Prepped Recipe”.
Once the Recipe is successfully executed, the new dataset will be available in the datasets section which we can use in CRM Analytics.
To keep the data up-to-date with Salesforce, the Opportunities Prepped Recipe can be scheduled to run right after the SFDC data sync occurs. Now that we have a new dataset containing all the relevant Opportunity data, we can work on preparing our finalized dataset which we will use for analytics.
Part 2: Creating a Recipe to Manipulate the Dataset
Here we will be implementing transformations to the dataset we created above. Following are examples of transformations that could be applied to the base dataset within CRM Analytics depending on the reporting requirements.
Bucket Close Date: Bucket the close date column into categories (Current quarter, 1 quarter ago, 2 quarters ago, and 3+ quarters ago)
![]()
Date Difference: Add another column to calculate the age of the opportunity, which will be difference between the start and the end date
![]()
Additional Function – Case Statement: Create another column for stage name to help sort the data based on the flow of the opportunity
![]()
Filter Data: Only keep data of those Opportunities which are closed
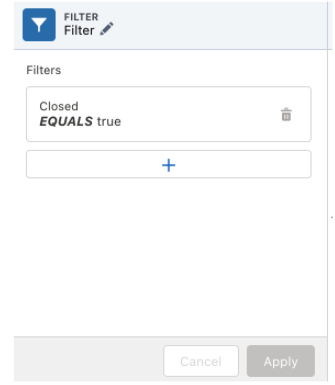
Once these transformations are applied you can create an Output Node to create your finalized dataset, which can be incorporated to build dashboards and stories.
Summary
This review has focused on the tools available in CRM Analytics Dataprep Recipes and the steps that go into creating an Einstein Discovery ready dataset. Next time, we’ll jump into Einstein Discovery for modelling purposes. If you have any questions about this blog or how to leverage CRM Analytics and Einstein Discovery to solve enterprise business challenges, reach out today!