
Half a decade, wow! If you’d asked me on that first day, I’d have confidently said the company would still be around in 5 years. If you’d asked me about a month later, I might have felt otherwise, but here we are.
Like most organizations, in January of each year, we crunch the numbers and see how we performed against our goals. What is different about CloudKettle is that we also publish a post highlighting interesting facts and figures about the previous year’s performance.
CloudKettle has no investors or board to report our year-end figures to, or be held accountable by (which has its pros and cons). But, much like we share our annual plans and goals with a circle of trusted friends for feedback, we also believe there is a lot to be gained from being publically transparent as an organization.
The figures presented in this post are a combination of business metrics and other numbers that speak to how much gets measured at CloudKettle. We’re quants by nature and, for me in particular, this is my favourite post each year.
If you’re curious about how previous years went, you can read our other annual recaps here:
- CloudKettle Year 4 by the Numbers
- CloudKettle Year 3 by the Numbers
- CloudKettle Year 2 by the Numbers
- CloudKettle Year 1 by the Numbers
Reviewing the oldest post (CloudKettle Year 1 by the Numbers), I am reminded that in our first year of business, the client I spent the most time with was Spring Loaded (who were also a very new company at the time). Five years later, they are still a valued client and have been incredibly successful. You can learn more about how their bionic knees braces are changing lives here.
Also, looking back at that first post, I am reminded that Nadine Noble, owner of IdeaNest, not only created the CloudKettle logo but also much of our art (including the graphics we use for this post every year). She continues to be the true owner of the CloudKettle visual identity.
We’re very fortunate to have been able to build such long-standing relationships with our partners on both the client and the vendor side.
Who We Help (Our clients)
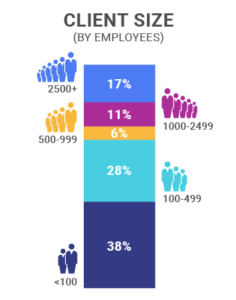
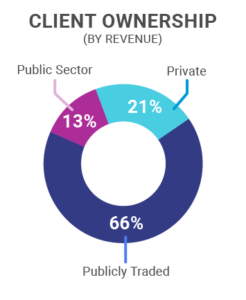
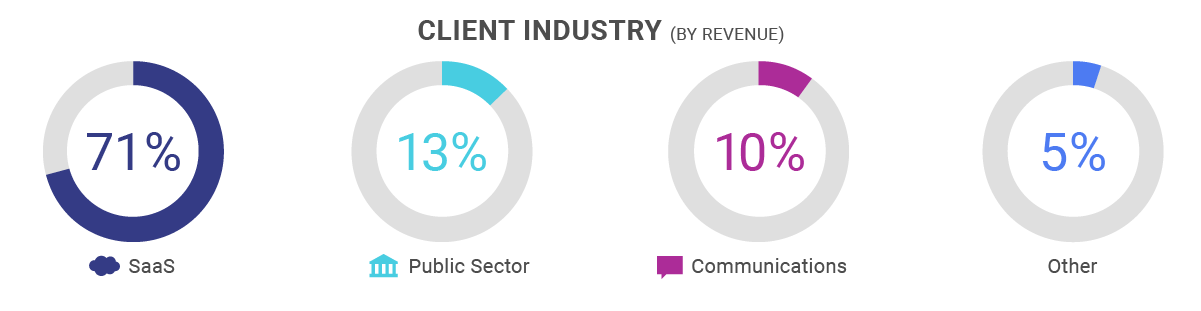
CloudKettle continued to service more enterprise clients in 2019. Our client base has matured (our oldest client, BCE, was founded almost 140 years ago), grown in size (over a quarter of our clients have 1,000+ employees) and two-thirds of our revenue came from publicly traded companies in 2019.
Growth
This year the number of clients that CloudKettle serves grew 125%, and almost all are on long term (annual) retainers. Our focus on long term engagements is intentional; we’ve always believed it creates alignment between clients’ needs and the quality of the service and solutions we provide.
- Long term Debt*: $0
- Clients who increased their investment in CloudKettle in 2019**: 33% (37% in 2018)
- Clients who are in their first year of working with CloudKettle: 67%
*Does not include monthly rotating debt like credit cards.
**Clients who spent more in 2019 than 2018 with CloudKettle over the same period of time.
 As we’ve grown over the past two years, it has been really interesting to see how Marketing Automation has contributed to that growth. Up until 2018, Sales Cloud related work and expertise was by far the biggest driver of revenue for us. But in 2019, we saw revenue from our Marketing Automation practice (primarily Marketing Cloud) grow to be on almost equal footing with Sales Cloud (23% for Sales Cloud vs 20% for Marketing Cloud and Pardot). In 2020, we expect these two core competencies to be near equal in their contribution to revenue again.
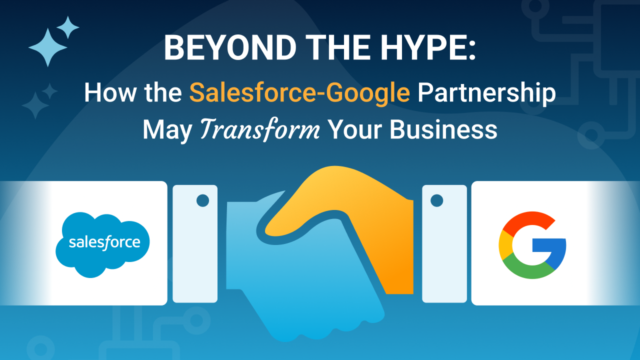
Another area of our business that grew in 2019 was the amount of work we did integrating the Salesforce and Google ecosystems. Salesforce and Google are tight partners, and their platforms are complementary. Integrating Google Analytics with Sales and Marketing Cloud, as well as pushing Sales and Marketing Cloud data into BigQuery for analysis as part of a larger Data Warehouse strategy and then providing business insights.
Not many organizations specialize in both ecosystems (CloudKettle is both a Salesforce and Google Partner). Connecting the dots between these two platforms has become a core area of our business, and is work we do for over 20% of our clients.
Referrals
It’s rewarding to see that our revenue continues to be driven by referrals. For the company to continue to expand at a healthy rate, there needs to be more diversity in where clients come from. However, it still feels great to know that 99% of CloudKettle revenue came from referrals in 2019. A big thank you to all our clients, Salesforcers, and other friends who have spoken so highly of us. 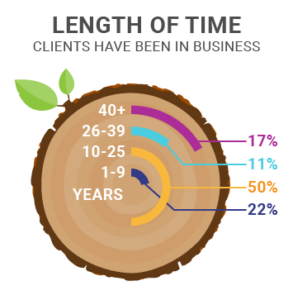
The Team
Onboarding new clients means also growing a healthy team. We increased the number of CloudKettle employees by 50% this year. Similar to previous years, we did not achieve our hiring goals; but that is an unfortunate by-product of a tight labor market and our focus on only hiring the right people.
This year we continued to invest heavily in helping our team build their skills. Kettlers carry an average of 2.72 Salesforce certifications. In fact, we had a 65% increase in our Admin certified team members overall.
These certification exams by Salesforce are difficult to pass, and every team member at CloudKettle (including Operations team members like our Office Manager) carry the Salesforce Admin certification. It has been amazing to see how effective our internal training camps are at leveling up the team’s skills across disciplines. I feel strongly that this focus on continuous learning has contributed to another year of 0% turnover.
Travel
Like previous years, the CloudKettle team spent a lot of time in the air, visiting our clients and ensuring we understand their needs. While we’d love to spend more time at home with our families, travel is part of what makes the machine run smoothly.
 With that in mind, here are our travel numbers this year:
- Most used airline: Air Canada (no change from previous years)
- Longest trip: Two weeks in November for Dreamforce (no change from previous years)
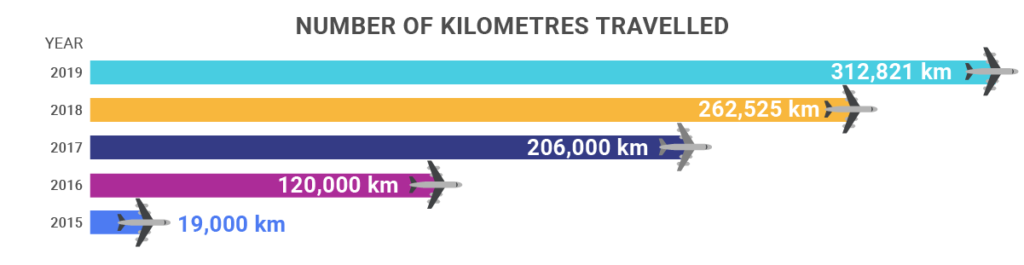
- Number of km travelled: 312,821 ( up from 262,525 in 2018, 206,000 in 2017 and 120,000 km in 2016)
- Most expensive ride share or cab $82 ($98 in 2018, $76 in 2017, $94 in 2016 and $55 in 2015
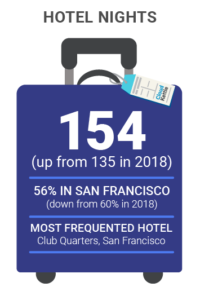
- Hotel nights: 154 (up from 135 in 2018, 117 in 2017)
- Most hotel nights – Club Quarters, San Francisco (no change from previous years)
- 56% in San Francisco (down slightly from previous years).
- With the high number of team members we send to Dreamforce each year, the amount of time we spend at Salesforce HQ, and our overall client base in San Francisco, it is unlikely this will ever change.
The Salesforce Ecosystem
We’re a company that is in love with Salesforce. Every client of CloudKettle uses Sales, Service, or Marketing Cloud. Many are using multiple platforms (for a third of our clients we are doing work on both Sales Cloud and either Marketing Cloud or Pardot).
Some figures from CloudKettle’s participation in the Salesforce ecosystem:
- Partner Type – Silver (will be Gold in 2020)
- Trailhead Badges – approximately 1,000 across the team
- Presentations at Dreamforce 2019 – Six (see list below)
- Percent of the team carrying at least one Salesforce certification – 100%
In addition, as part of our commitment to growing the Salesforce ecosystem locally, CloudKettle team members host three free Salesforce Saturday training cohorts. These run for 12 weeks each, with cohort members attending regular classes and completing exercises and homework. Demand is high and we get many more applications than can be accommodated. We give preference to individuals who might struggle to pay for this type of training if it wasn’t free and to whom it will provide this biggest leg up in their career.
At the end of a cohort, participants leave with the skills and knowledge required to pass their Salesforce certification exam. Several participants have also found employment soon after graduation (including at CloudKettle and with our clients).
Some interesting stats from our 2019 Salesforce Saturday cohorts:
- 150 people applied, with an overall acceptance rate of 14%
- Two Salesforce Administrator cohorts and one Salesforce Developer cohort
- 50 hours of free instructor-led training was provided to the community by our team (plus prep time, homework correcting and helping students throughout the week)
Dreamforce
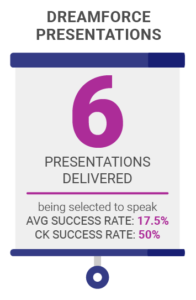
Being selected to speak at Dreamforce becomes more difficult every year. This year, the Salesforce Admin track received 60% more submission than 2018, with a whopping 1,435 submissions total. An average of 10% Admin topics and 25% of Developer topics were selected in 2019. CloudKettle fared very well, with 50% of our 12 applications being chosen for Dreamforce 2019.
These were our six Dreamforce sessions (with links to videos and resources where available):
- The Value of Having a Dedicated Integration User
- Using Quip for Better Documentation of your Salesforce Org
- Lightning UX Design Process for Salesforce Developers
- How to Enable a Deeper Connection Between Sales Cloud and Google Analytics 360
- How to Grow Your Business with the Salesforce Partner Program
- The Key to SI Partner Success: How Specialization Drives Results
Where We Missed
We don’t get everything right – each year has its own set of disappointments. Looking back over five years, I have very few true regrets, but we also hold ourselves to a high standard.
Despite growing revenue and team size this year, we still missed our goal for both. In part, our revenue number miss is the direct result of our inability to hire as many amazing team members as we’d like. Customers come first, and we won’t take on more work than we can effectively deliver. This often means sacrificing short term revenue for long term quality of work and happy clients (a sacrifice I’ll always gladly make).
We also missed many of our marketing goals this year. A thin team means our marketing needs often come last. As an example, we only achieved about 10% of our target growth in newsletter subscriptions this year. At times throughout the year, we even intentionally slowed demand gen activities because we knew we were peaking in the amount of new work we could take on. It didn’t make sense to drive more demand with paid advertising efforts if we had to turn those new prospective clients away.
Content That Killed
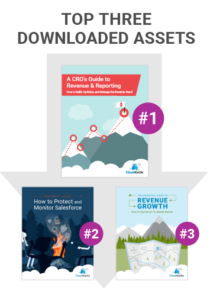
Similar to previous years, content was a major source of our leads. Organic traffic, driven largely by an increase in blog posts, drove people to assets like our Security and RFM Guides and made up 44% of our leads. Digital ads (primarily in Google’s Ad ecosystem) for these same assets made up another 44%. The remainder of our leads, which, while small, made up the majority of our new sales, came from events like Dreamforce and referrals.
What is more interesting than where leads come from, is the impact that content has on existing leads. Referrals are fantastic, but they do vet CloudKettle in advance – we can see that most referrals visit our site and download assets in advance of reaching out to us. They trust the referral, but still want to verify our expertise.
Volunteering
In 2017, CloudKettle became a Pledge 1% company, and since then, our team members have donated 1% of their work days and we have donated 1% of our profits to charities. This year, we exceeded our goal for volunteer hours, with our team providing tens of thousands of dollars in free help to organizations.
As a part of those hours, our team worked with three nonprofits in particular to help them better leverage their nonprofit versions of Salesforce (NPSP). Assisting organizations to get the most out of their NPSP instances of Salesforce allows us to multiply our impact because they also benefit from free or very reduced licenses from Salesforce (S/O to Salesforce for donating 1% of their product to nonprofits annually).
Finally, congratulations to Lisa Muise, who was our top volunteer, with the most work hours donated of any Kettler this year.
Why These Figures?
Every year this is my favorite post to write. We preach transparency internally and we ask our team members and clients to be transparent with us. Whether you are a perspective new team member, a client, a potential client or one of the many folks who have helped us over the years – I hope these stats (some serious, some just a sign of our numbers focused curiosity) were interesting and even helpful for you.
Wondering about a number we didn’t mention? Have feedback? Get in touch by clicking here. We’d love to hear your thoughts.