
Each year we look back at how CloudKettle performed and publish a post highlighting some of our most interesting facts and figures. We’re an analytical group of people and this is one of our favorite posts to write every year. The stats presented in this post are a combination of business metrics and other numbers that speak to how much gets measured at CloudKettle.
If you’re curious about how previous years went, you can read our other annual recaps here:
- CloudKettle Year 3 by the Numbers
- CloudKettle Year 2 by the Numbers
- CloudKettle Year 1 by the Numbers
An important piece of context to know is CloudKettle has no investors or board. So, unlike most organizations, we don’t have that higher power to report our performance to. That being said, we think there is value in transparency and this post is part of our commitment to being open with our team, our partners, and our clients.
Contributing to the Salesforce Ecosystem
This year we introduced two Salesforce applications to compliment our professional service offerings (one free and one paid). In August, we made our BANT application available for free on the Salesforce AppExchange. It provides organizations with an easy way to deploy the BANT lead qualification methodology in Salesforce, helping Sales teams qualify leads.
On the paid side, we launched Salesforce SafeGuard to provide organizations with a simple and efficient way to monitor and protect the health of their Salesforce Sales Cloud instance. Working on this has been one of the most rewarding things I’ve done at CloudKettle. It’s been incredible to watch the team take the last three years of experience monitoring our client’s Salesforce instances and transform those learnings into a SaaS offering.
Financial Metrics
This year we continued to focus on helping organizations (primarily B2B SaaS companies) improve the strategy and technology behind their Sales Operations (SOPs) and Marketing Operations (MOPs). This continues to mean, the majority of our efforts revolve around the Salesforce and Google Marketing ecosystems (in particular Sales Cloud, Marketing Cloud, Google Analytics, Big Query and DataStudio).
This focus has historically helped CloudKettle grow in a healthy, sustainable way and 2018 was no exception:
- Debt: $0
- Clients who increased their investment in CloudKettle in 2018: 37%
- USD Revenue: 91% of our revenue is USD, up from 86% in 2017 and 51% in 2016.
- CAD Revenue: 9% of our revenue comes from Canada, and while the total dollars grew, it was not at nearly the pace of the overall pie growth (so the % shrunk on a YoY basis)
Each year we have been focusing more on our expertise in the Revenue stack and have been tracking the % of revenue that comes from work directly on and surrounding Sales and Marketing Operations strategy.
- 2015: Revenue directly related to Salesforce or Revenue Stack work: 36%
- 2016: Revenue directly related to Salesforce or Revenue Stack work: 85%
- 2017: Revenue directly related to Salesforce or Revenue Stack work: 99%
- 2018: Revenue directly related to Salesforce or Revenue Stack work: 100%
So, while we are diversifying by offering a SaaS solution (SafeGuard), our focus on the work we do has become more honed. We continue to see our success fueled by our expertise in B2B SaaS, with 95% of our revenue coming from organizations that are B2B SaaS vendors. This is a large part of what helps us provide value to our clients and why our referral rate is so high. Referrals accounted for 57% of our 2018 revenue, with the remaining 43% primarily coming from leads generated by content.
Where We Missed
 No year is perfect and 2018 was no exception. Our goal was to approximately double revenue this year and we landed slightly short of our target. This was after meeting or beating our targets in Q1, Q2, and Q3, but falling short of our (retrospectively rather ambitious) growth target for Q4.
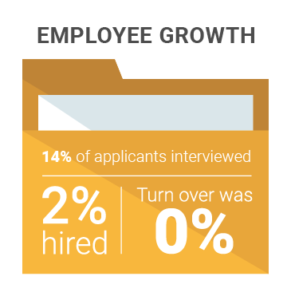
The type of year-over-year growth CloudKettle has needs to be fueled by a great team. Every hire is important and we believe in taking our time, which is why each candidate goes through five interviews before becoming a member of the team. We are intent on finding smart, curious, and passionate people to add value at CloudKettle. So, while we were able to add some great Kettlers this year and grew our team size by 116%, we missed our hiring goal by three people.
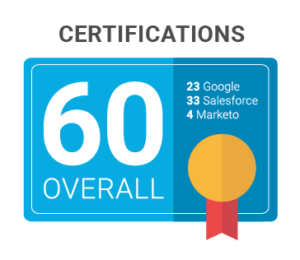 Adding new team members has also meant formalizing our training and onboarding programs. We consider industry leading certifications (like Salesforce’s program) to be a KPI of employee progression and we’ve made huge strides in this area; as a team, we currently hold a combined 60 Salesforce, Google, and Marketo certifications.
As the saying goes, “the cobbler’s children have no shoes” – while as a company we help clients with their Marketing efforts every day, carving out resources for our own internal Marketing efforts is a struggle. This year we made some major strides particularly around content generation, speaking engagements, and guest posts. However, we didn’t execute on everything we’d set out to do, including, growing our newsletter subscriber list. One of our goals in 2019 is to bring more quality content to a growing newsletter following.
Who We Help
Without great clients, we’d be nowhere and we’re happy to say they’ve had a great year as well, with some having double and triple-digit growth, several closed rounds, and expansion into new territories.
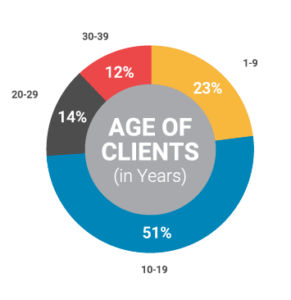
Like previous years, we saw the age of the organizations we serve and their size grow. Like last year, we had no clients under five years of age and the percent of our clients that are under 10 years of age has dropped significantly.
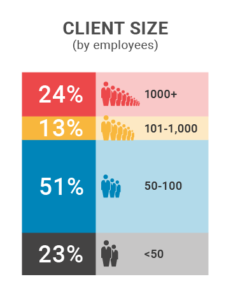
Similarly, the size of our clients (by employees), has increased, with a quarter of our clients having over 1,000 employees.
Built on Trust
In previous years, organic inbound efforts were almost our entire source of leads. This year organic was high at 38% with paid advertising efforts a close second at 31%.
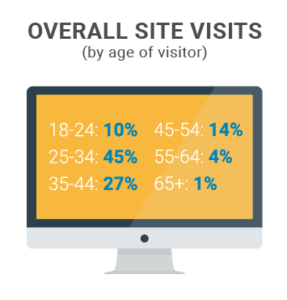
When we look more deeply at how our content (and site overall) performs, there are some interesting stats. Generally, the more mature a visitor is (in years), the more likely they are to convert into a lead. Our content and advertising have traditionally targeted VP and C-suite roles, so this isn’t surprising.
The overall conversion rate for the site is 3.36%, but the age cohorts of 45-54 and 55-64 convert at 5.5% and 5% respectively.
That, unfortunately, isn’t reflective of the overall visits when reviewed by age.
Content That Killed
Our digital content continues to be strong at driving visits and leads. For the second year in a row,
our BANT (Budget, Authority, Need and Timeline) blog post drove the most traffic to our site, with 5 Steps for a Successful B2B Renewal coming in a close second. Both posts are older ones that we’ve refreshed this year and they continue to perform for us.
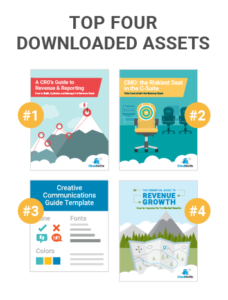
In terms of downloadable assets, our CRO ebook was the workhorse of the year yet again followed by our CMO eBook, our Creative Communications Guide, and our Revenue Growth eBook.
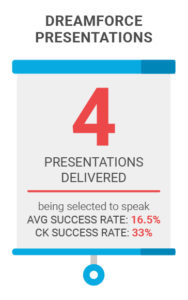 Getting selected to speak at Dreamforce is tough and an average of 13% of Admin topics and 20% of Developer topics were selected in 2018. CloudKettle submitted 12 topics and had the privilege of speaking four times and we’re looking forward to growing that in 2019. Here are the video and/or voice recordings of our sessions:
- Salesforce Security: Admin Checklist
- Circles of Success for Partners: Stand Out in the Consulting Partner Program
- Partner Success with Trailhead
- The Value of Having a Dedicated Integration User
Travel
With CloudKettle’s level of growth, it is no surprise we’ve been traveling. We’re client focused and that means many flights to markets like San Francisco, Seattle, New York, and even India to meet with them. Here is how we hit the tarmac in 2018:
- Number of countries our clients are founded in: 4
- Number of km travelled: 262,525 (up slightly from 257,701 in 2017 and 51,701 km in 2016)
- Most used airline: Air Canada
- Longest trip: Two weeks in September for Dreamforce
- Most expensive car sharing or cab: $98 ($76 in 2017, $94 in 2016 and $55 in 2015)
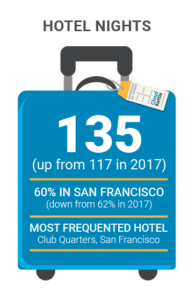
- Hotel nights – 135 (up from 117 in 2017)
- 60% in San Francisco (down from 62% from 2017)
- Most hotel nights – Club Quarters, San Francisco
Volunteering
We continue to grow our efforts to give back to our community. Becoming a Pledge 1% member in 2017 was a big milestone for us and we’ve continued to donate 1% of our time and profits to non-profit organizations in 2018. Shout out to Lisa Muise and Mitch Hussey, who were our top volunteers, with the most work hours donated of any CloudKettler this year.
Why These Figures?
Every year this is one of our favorite posts to write for two reasons. One, we’re a curious and numbers-focused bunch. Two, we preach transparency and this post is part of our commitment to uphold the level of transparency that we ask of others.
Some stats are very relevant to the business, others are things we were curious about ourselves and decided to share them with you.