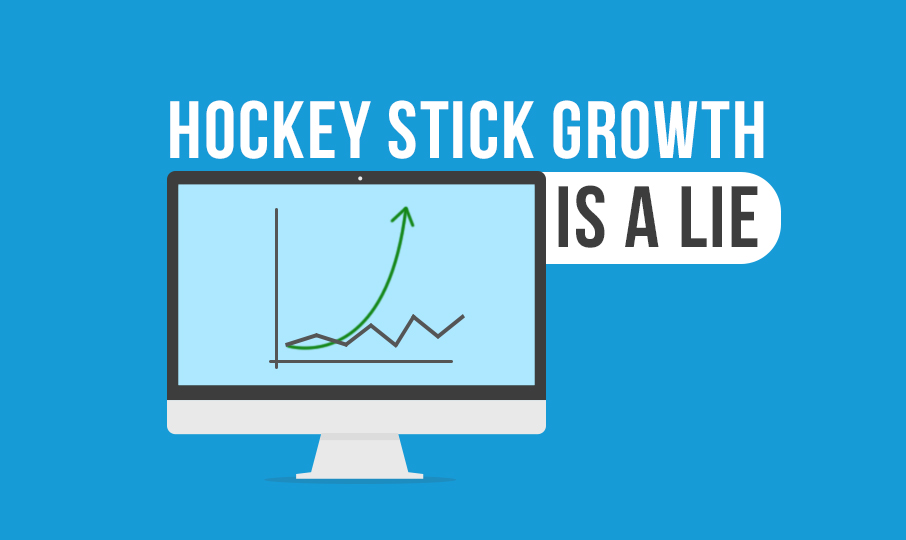

Throw it away. It’s a lie and makes you look foolish to investors.
Why Hockey Stick Growth is Lie
There’s only one reason you see you a growth curve like that; it’s what you get when you put a repeating formula in Excel. Your investors know what Excel is. They know why that chart looks that way.
Now, I don’t mean hockey stick growth is a lie in the sense that aggressive growth assumptions are false. I work with SaaS companies every day and have worked at more than a few. I know forecasting an aggressive growth pace is part of the deal. Is it realistic? Maybe not – but high growth SaaS companies (often startups) are a gamble. Founders have to make assumptions when forecasting growth – everyone gets that.
What Hockey Stick Growth Demonstrates to Investors
Often I meet with startups so they can bounce their pitch deck off myself and other CloudKettle team members before going to meet with an investor. Inevitably, the hockey stick slide comes up. I’ll tell them I don’t believe the projection and press them on how they came up with the figure. After the routine excuses everyone makes, I’ll say, “Ok I’m going to ask you three questions, and after, I guarantee you will change this slide.” This is usually met with skepticism. After all, a lot of work has gone into the deck, and founders are advised to stand their ground when questioned while pitching.
- Do any of your customers have children?
- Do any of your customers live in the United States?
- Do you sell to decision makers and interact with their legal departments?
If you answered yes to any of the questions above, a perfect hockey stick growth curve is not possible at your SaaS company – and I’m going to tell you why.
What to Consider when Forecasting Growth at your Fast-Growing SaaS Company
Here’s the thing – every business has an annual business cycle. This is especially true if you sell a SaaS product to important people and companies that have budget planning cycles.
Important people (aka decision makers) all take vacations. They take them in the summer, they take them in December, and they often take them with their families. To forecast that you’re going to close business at the same pace of growth in August (in peak vacation season) as you did in May – is naive at best.
How about Christmas? Are your clients going to be picking up the phone as much during the holidays? All it takes is one employee from Legal, Procurement, or Infosec to be on vacation to significantly stall a deal. It only takes that one person in Procurement who issues POs to delay a sale three weeks until they are back from their timeshare or family vacation home in Northern Vermont. No matter how motivated your executive sponsor is, they can’t issue POs or sign sizeable deals without other groups giving the official ok.
Annual Business Cycles at SaaS Companies
Across all the SaaS companies we work with, we see a few seasonal consistencies. This is US-centric, but our clients tend to see a small bump early in the summer as people try to tie up loose ends before vacation time. Then there is a big dip in August, with an equally large rebound a week or two after Labor Day.
Decembers are slow, except when clients are dumping budget before a fiscal year end. The slowdown starts on Black Friday and continues through the second week of January. As annual budgets renew or seasonal slow times roll through your industry, there will be big bumps in sales. Most organizations don’t want to purchase/implement new software at their busiest time of year. They want to do it when they are slow.
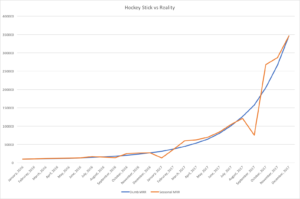
So what does a realistic growth chart look like? It is going to be different for every company and probably be full of assumptions. But it should never be smooth. The “Seasonal MRR” line in the chart above shows what a more realistic curve would look like for our clients. There are slow ebbs and flows through the year and then big dips and rebounds around August and December.
Why does this matter?
Obviously, you want to demonstrate to investors that you know what you are doing. When pitching at a previous company where I was CTO, I’d pull charts directly from the CRM the morning of the pitch. We had reports (with charts) built in Salesforce that we could use to pull real-time forecasting. Conveniently Salesforce allows you to save an image of these that is almost the exact size of a PowerPoint slide. We’d put that in our presentation titled “Revenue Forecast as of this Morning, 9 am.”
Wrap Up
Send a powerful message to your investors by using a real-time forecast. Beyond illustrating that you aren’t using a dumb repeating formula, you’ll demonstrate that you understand your customer’s buying cycle. For more advice on how to level up your pitch from the 20 other pitches, your VCs will see that week, get in touch.